KEY TAKEAWAYS
- Visual tools simplify complex systems into clear, actionable data formats.
- Dashboards help streamline workflows and align teams with real-time metrics.
- Choosing the right tool depends on team size and data needs.
- Real-time visuals improve decision-making and system responsiveness instantly.
McKinsey & Company has reported that organizations that can effectively use data visualization can gather 23 times more customers, and the retention rate also goes over 6 times.
Digital infrastructure is filled with complexities, and this is why using smart, visual-first solutions has become crucial. It helps with decision-making, optimizing workflows, and enhancing system transparency. The right tool, like https://www.jvsg.com/camera-placement-tool/, can be a great addition.
In this article, I’ll mention how visual tools streamline processes, support real-time decisions, and even incorporate innovations like AI. Let’s get started.
Visual tools can take a variety of complex digital systems and reduce them to visualizations that are simple and coherent. Visual tools enable us to visualize a vast amount of data, surface inefficiencies within systems, and pinpoint areas where improvements can be made.
By visualizing operations, everything from workflow to infrastructure, teams can easily identify bottlenecks and track performance in real time. A visual interface provides instant clarity from raw data. Visualizations can improve productivity and reduce error rates.
The more complex the system, the more useful visual tools are in organizing information. Visual sources of information are commonplace in how contemporary organizations develop, operate, and manage complex digital systems in order to achieve efficiency and organizational agility.
By consolidating metrics for key performance indicators and subsequently visualizing them, dashboards and data visualization software can assist organizations with improving their workflows. Teams can see updated measures in near real-time, monitor key performance indicators, and track all projects from the same interface.
Dashboards reduce collaboration challenges, eliminate unnecessary overlaps, and better enable what actually should be prioritized. In general, if organizations can spend less time on gathering reports or interpreting spreadsheets, their workflows will be faster and more accurate.
Additionally, visual dashboards improve information sharing across departments, offering teams the opportunity to align their objectives and decision-making. We are increasingly reliant on technology, and data is everywhere.
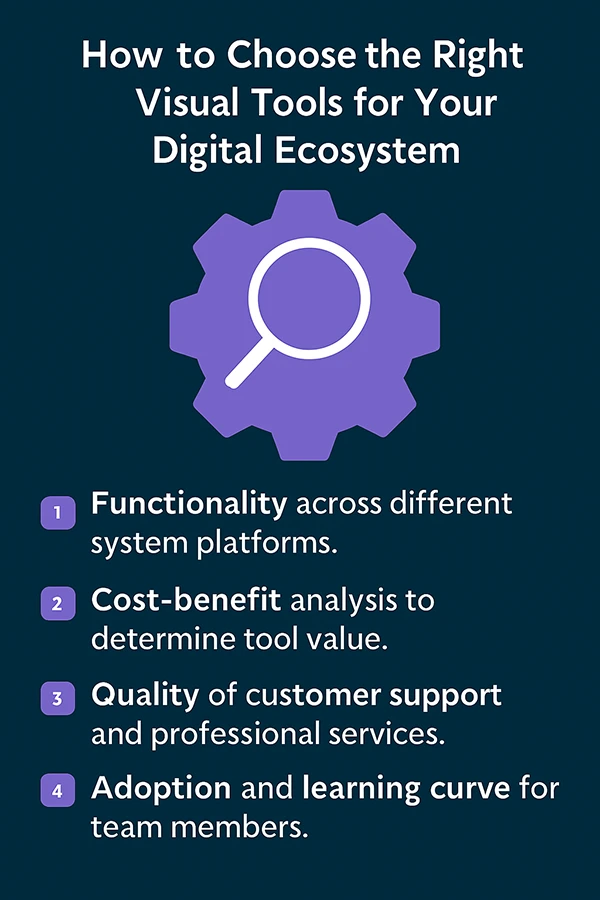
Every visual tool has a different function, and it’s important for you to pick the one that aligns with your needs and goals. Team size, user knowledge, project complexity, and data volume are all significant considerations for the selection of effective tools.
Development teams might like the flow chart-based UI/UX tools, while executives would appreciate an analytics dashboard because it organizes all of their strategic KPI’s. Tools should integrate with other systems to eliminate data silos.
Make sure that the tool you are settling for is scalable, customizable, and has real-time capabilities. When you make the right investment in the tool you use, you can improve usability, improve decision-making, and significantly improve the overall performance of your entire digital ecosystem. Below, you can see how to choose the right tools.
You can make data-driven decision that allows you to act based on real-time information with real-time visualization. Whether monitoring the uptime of systems, decomposing customer behavior, or course-correcting marketing strategies, visual tools keep everybody in the loop.
The explicit visual needs around data can provide a sense of patterns and trends that are not defined by static reporting tools. Heat maps, graphs, and real-time dashboards can provide access to a more intuitive understanding of information in ways that might be impossible to see without getting technical.
The ability to act on data with a real-time connection can allow organizations to become more responsive in unpredictable environments, eliminate downtime, and keep a competitive advantage. With the ability to act based on visual insights, an organization can leverage previous data and make strategies that are more effective.
The future is about AI-driven tools with a visual component that will automatically interpret, anticipate, and act on the data, going beyond traditional reporting to dynamic predictive analysis and anomaly and recommendation generation.
These tools will change the way teams leverage technology, which would allow for real-time predictive analysis, real-time deviations, or historical context to create and automate recommendations.
The marriage of automation and visual platforming now allows repetitive tasks to be automated and a fast, efficient response to deviations. These intelligent systems add context to how we visualize the data, and will make us not only faster in our decision process, but smarter as well.
They take the complexity of all data, simplify it, identify areas of weak performance, and reassemble systems to improve operations with insights on demand.
They integrate separate data sets into one view, eliminate unnecessary tasks, and keep Timely data front and center around alignments and decisions for the team.
AI is beneficial to visual tools in that it provides predictive insight, automates some of the insight, and provides small-scale recommendations to current actions of the digital operation.