Did you know? 63% of companies find that data-driven decision-making increases their productivity, according to Edge Delta.
In today’s highly competitive marketplace, small businesses cannot afford to gamble with their decisions.
Data-based decision-making was once the exclusive territory of the big companies with the big budgets, but it can undoubtedly be a major, and game-changing, asset for small businesses and entrepreneurs alike.
When you apply data, any-sized company can find points of data that will positively assist them to grow, increase efficiencies, and differentiate themselves from their competition.
Small business owners do not need a full team of analysts or expensive tools. With a little strategy, small businesses can take advantage of data and make smarter decisions that lead to better and more sustainable outcomes.
So, let’s discuss how small businesses can think about data usage through this expansive blog post centered around this concept.
Let’s begin!
Key Takeaways
Understanding everything about collecting customers and sales data
Exploring how to leverage data for setting benchmarks
Uncovering analytics uses and data enhancement
Taking a look at the data-driven insights
The end note
Collect Customer and Sales Data
A convenient place for small businesses to begin with data is in studying their customers and sales. Businesses can learn how to develop new products, enhance marketing, and improve consumer experiences by combining data on sales, purchases, and product interest.
A small retail business can look at its point of sale, inventory, web traffic, and online sales data to find out which products generate the highest profits. The business can save money by investing in more maxi dresses and fewer rompers if customers are purchasing the maxi dresses at full price, but the rompers are not in demand. To make smarter product decisions, many small retailers turn to Looker Studio consulting to connect sales and inventory data with customer behavior insights.
Small businesses can use simple tools like Excel or Google Sheets to track basic data points over time, keeping the focus on vital metrics for the business. Then, data visualization tools like charts and dashboards can help spot trends and patterns easily. Many small business ecommerce platforms and POS systems now integrate basic sales and customer analytics as well. The key is consistency in capturing clean, accurate data over time.
Interesting Facts 64% of companies report improved efficiency and productivity, and 44% report improved customer experiences, according to a Harvard Business School report.
Tap into Market and Competitive Data
In addition to internal data, small businesses need to understand challenges, threats, and opportunities by analyzing market and competitive data. For instance, to compete and provide a product that customers need at a competitive price. A small SaaS business must have a thorough understanding of buyer demands, what larger competitors are offering, pricing standards, and growth patterns for their sector.
Market research has become incredibly affordable and accessible through do-it-yourself tools. Small business owners can find demographic, firmographic, and psychographic data on their target customer segment through market research companies like Euromonitor for minimal cost.SurveyMonkey and other consumer demand platforms offer valuable market sizing and feature priority information. Tools for website analytics provide low-cost or free methods of evaluating visitor activity.
Following industry leaders, analysts, associations, and publications on social media generates competitor and market intelligence.
By combining internal and external data sources, small businesses can assess product-market fit, set optimal pricing, deliver better customer experiences, and keep up with what competitors are doing – all based on data. Rather than relying on what they think customers want or past experiences, objective data enables small businesses to make decisions grounded in facts.
Leverage Data to Set Goals and Benchmarks
Small firms can define objectives and benchmarks using trustworthy historical data collected over time, and then use key performance indicators (KPIs) to monitor their progress. For instance, a small consulting business would record monthly information on conversion rates, sales cycle time, and sales-qualified prospects.
They can then set specific goals for lead volume, reducing sales cycle through improved nurturing, and increasing conversion rates through refined closing processes, quarter over quarter. With each initiative tied directly to revenue impact, the business owner can connect data to dollars, prioritizing what to work on first.
Common KPIs small businesses can start tracking towards goals include:
Sales metrics – number of sales, average order value, repeat purchase rate
Web traffic and engagement metrics – sessions, bounce rate, pages per visit
Lead generation metrics – cost per lead, sales qualified lead rate
Customer service metrics – first call resolution, customer satisfaction (CSAT) score
The right KPIs will be unique for every small business based on its growth strategy. The key is identifying metrics that tie to profitability and scaling. Once the metrics are defined, monitoring dashboards centralize data over time to highlight what’s working and what’s not.
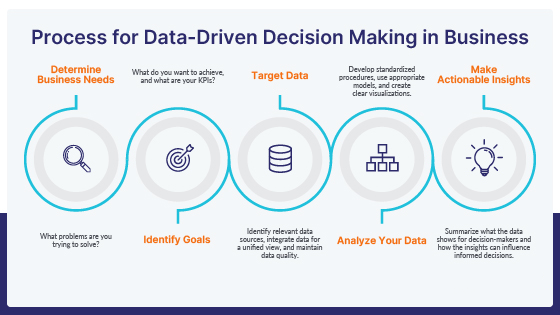
Intriguing Insights This infographic shows the process for data-driven decision-making in businesses
Leverage Data to Enhance Marketing
Typically, small businesses depend on the owner’s gut feeling to pick the best messages, deals, and methods to attract their target audience. However, they are able to eliminate uncertainty and improve their marketing plan in every aspect because of data. From ideal customer profiles (ICPs) to campaign outcomes, marketing performs better than most other areas when data-driven decisions are made.
Many small business owners hesitate to invest in marketing analytics because it feels too complex. However, tools like Google Analytics, Facebook Business Suite, and LinkedIn Campaign Manager all offer free versions with powerful insights. For small businesses, Google Analytics, which drives conversions primarily from their website, provides an end-to-end view of the customer journey from the first visit to purchase and beyond. Numerous indicators, such as traffic volumes, top landing pages, conversion funnels, marketing attribution, regional information, devices utilized, and more, are tracked by the user-friendly and adaptable dashboards. Similar insights are offered by Facebook and LinkedIn campaign tools for advertising and content promotion on both networks.
Without any technical resources, small businesses can leverage the self-serve analytics and campaign management platforms of these martech tools to instrument tests, analyze performance data, and optimize their web presence and digital marketing activities. As results of initial tests and campaigns roll in, they can reallocate budgets towards better-performing areas and improve messaging, creatives, and offers over time per the data.
Invest in a Business Intelligence Solution
The free or freemium analytics tools provide a starting point for small businesses to evolve towards more data-driven operations. They display data in silos, though, with one tool showing online traffic, another showing digital advertisements, and a third showing purchases. Small firms require an integrated perspective of the entire company, not just marketing, to make better decisions. Business intelligence (BI) solutions unify all data sources for a single source of truth that covers every aspect of the organization.
It was once difficult for small businesses to use BI because they did not have the funds for the necessary technology. Because of cloud BI platforms like Domo, Chartio, and Sisense, small businesses can now enjoy customized business intelligence solutions at an economical price. Standard data sources like as web analytics, digital ads, CRM, email marketing, e-commerce sites, and so forth offer pre-made interfaces for cloud BI applications. It implies that developers don’t need to start from scratch when creating their data pipelines. Since no technological knowledge is required, reports and dashboards may be created by simply dragging and dropping fields into the solution.
With easy access to real-time reporting across all business data in one place, small business owners gain visibility to make faster, more informed decisions daily. Rather than looking at individual reports from each system, they can instantly view website conversion rates, digital campaign ROI, sales velocities, inventory levels, and anything else critical to the business in one centralized dashboard tailored to their role.
Small firms can leverage insights found in integrated data to perform scenario planning and forward-looking predictive analytics as they assess development plans, expansion choices, and new initiatives, rather than merely reporting on past metrics.
Getting Started Making Data-Driven Decisions
Evolving from gut feel to data-driven decisions can feel overwhelming initially if small business owners don’t know where to start. The key is to begin small:
Identify key business questions – What data could help answer those questions to drive better decision-making?
Determine the data sources needed to gather that information.
Evaluate free or cost-effective tools to capture, store, and analyze the data.
Instrument tracking and reporting focused on vital metrics that tie directly to business health – avoid “vanity metrics”.
Define KPIs and benchmarks to set data-driven goals and quantify progress.
Build basic dashboards visualizing key data points, trends, and insights.
Train staff to interpret the data and apply findings to everyday decisions.
Then iterate – analyze data, test changes, learn, and optimize. Over time, build toward an integrated data stack and a centralized, data-driven culture.
Common challenges small businesses face on their data journey include a lack of time, budget constraints, and skill gaps. That’s why it’s critical to start small, leverage free tools and resources, instrument basic building blocks first, and scale capabilities over time. The key is not perfecting a complex data infrastructure right away but establishing the right data-focused mindset and practices early on.
Conclusion
Since data and analytics are expanding so rapidly, using data is now essential for any business to succeed. Big businesses use large budgets to hire data experts, but small companies can still make use of data in their decision-making. Prioritize the most important company KPIs first, use free cloud solutions, and focus on basic data tracking. Data supports our beliefs and motivates small business owners to take more risks rather than disregard their intuition. Businesses use data to create more effective growth strategies rather than relying solely on conjecture. Small businesses can start using data like the enterprise by using easy-to-use technology, having the right processes, and a culture that supports learning and improvement. The moment to use data in decision-making has arrived.
FAQ
How does data analysis influence business decision-making?
Data analysis transforms raw data into valuable insights, revealing patterns, trends, and opportunities that might otherwise remain hidden.
What is business statistics and data analysis?
Business statistics refers to the use of different data analysis tools from statistics and applying those in a business setting. There are two main types of statistics, descriptive statistics and inferential statistics. Descriptive statistics use all the numbers in a data set.
How can data be used to make business decisions?
By relying on data and analysis, business leaders can make decisions rooted in facts, not influenced by personal biases or opinions. With this objective approach, you gain a holistic view of past and ongoing efforts, allowing you to refine strategies and reduce the risk of costly mistakes.