The complexity of the financial terms can be very confusing sometimes, whether you are a veteran trader or a beginner who has just started trading.
One such term, or, let’s say, an indicator, is the relative strength index (RSI), which can be very challenging sometimes. Nevertheless, it is also a tool that can open doors for new opportunities to help thrive in the financial market.
Thus, in this article, we are going to explore every piece of information about RSI that is required in the trading process. Here, we learn the common RSI trading strategies and how RSI can be utilised in smart trading decisions. So, without any delay, let’s dive in! Also, learn about Quantum AI Trading by reading this article.
The relative strength index, or RSI, is a technical indicator that measures the speed and changes in price movement. It is often used in the analysis of financial markets to measure the strength of an asset’s price over a given period of time. It is considered the top indicator by the traders that fuels the investment strategy.
On the charts, it is displayed between 0 and 100, where the line moves up when oversold and down when overbought. The values of 70 or above show that an asset is overvalued, and the value of 30 or below shows that a security is undervalued. This allows the traders to have a visual representation of an asset’s price momentum.
In simple words, it checks the change in asset prices and determines if a change happened way too quickly. RSI measures this by comparing the size and speed of recent gains or losses and identifying market trends.
This indicator and its formula were developed by Welles Wilder based on historical market data and personal observations. Since its invention 40 years ago, this technical indicator has now become the trader and investor’s top choice to evaluate short-term, intermediate-term, and long-term price trends.
Now that we know what RSI is, let’s explore how to calculate it!
To calculate RSI, you can use the following formula: RS = RSI = 100 – (100/1 + RS). After you obtain the RS value from this equation, you can use the graph to plot the RS and check for fluctuations in the asset value.
However, many traders have interpreted different ways to obtain RSI. But, choosing the right indicator that best suits your trading strategies is in your hands.
Talking about strategies, let’s learn what the RSI trading strategies are and how they help in smart trading decision-making.!
To influence smart decisions on the top trading platforms, you can use RSI trading strategies and detect possible changes in prices. Thus, now we are going to take a look at the four strategies that use the RSI indicator to detect potential changes in trading.
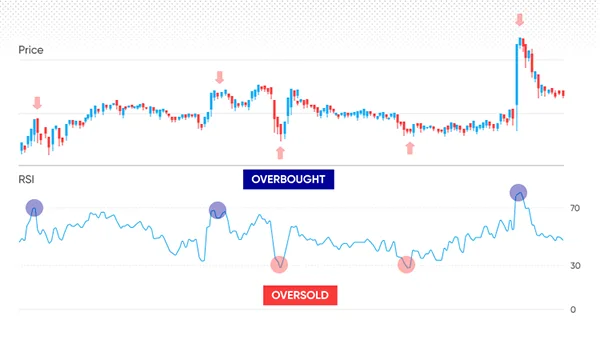
When an asset is overbought, it starts to point lower and is expected to see a fall in prices in the future. On the other hand, when an asset is oversold and points higher, it will see a price rise.
Thus, if you are looking to buy securities at low prices (long positions), wait until the RSI rises above 30 and moves from an oversold condition. Similarly, if you want to sell stocks at high prices (short position), you must wait until the RSI reaches below 70 and moves from overbought conditions.
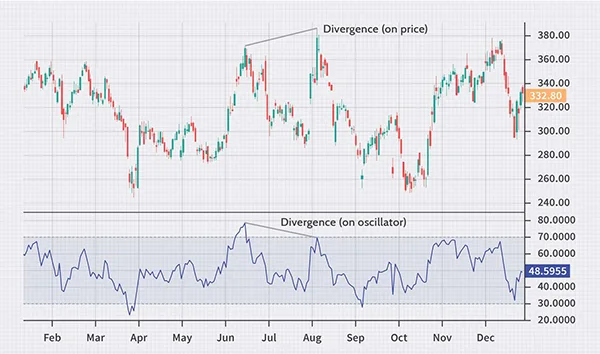
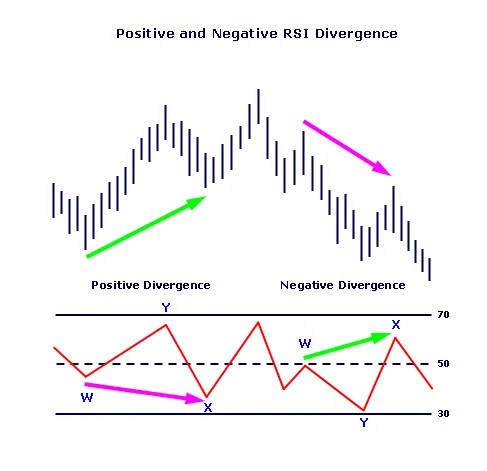
RSI divergence is the point where the momentum of RSI lines and price lines moves in a completely different direction. This aspect is what most traders look out for in the RSI graph.
There are two types of divergences: bullish divergence (when the price falls and the RSI moves upwards) and bearish divergence (when the price rises and the RSI moves downwards).
These divergences often increase the chances of a reversal in prices and create an opportunity for sudden buy-and-sell events.
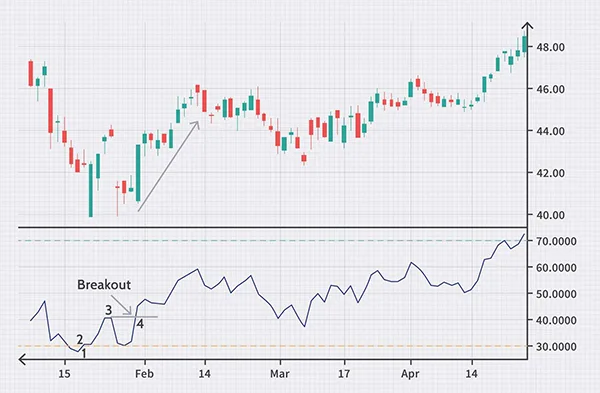
RSI Swing Rejection is a similar concept to divergence, where the price lines and RSI lines diverge from each other. But here, it ensues on a smaller scale compared to divergence. Thus, the swings only show the small highs and lows in the graph.
To check when it’s a good time to purchase or sell the stocks, you can check the trading opportunities using the same process as divergence. By understanding these price changes, you can become a master of swing trading.
In a positive reversal, an RSI reaches a low that is lower than the previous one, and the asset’s price reaches a higher price that is higher than the previous one. This reversal indicates an auspicious sign and allows the traders to buy the asset.
In a negative reversal, an RSI reaches a high that is higher than the previous high, and the asset’s price hits a low that is higher than the previous one. Hence, here, you can sell the assets as it is considered a negative omen.
Note:
Many traders use the RSI 50 level (the centerline) to determine that a price trend is occurring.
You can use these above-listed strategies to buy and sell your assets at the right time and take advantage of the volatility of the market.
RSI can be a good indicator to detect any price changes in a specific asset; however, it’s not completely accurate and has limitations. Thus, we are going to take a look at the pros and cons to help you decide whether you want to leverage this indicator in your trading decision-making.
Pros and cons of using the RSI indicator in trading:
| Pros | Cons |
| Uses a simple mathematical formula compared to other technical indicators | Loses its usefulness in front of the strong trends in Forex |
| Even beginners can analyze the charts | RSI may remain overbought and oversold for a long time |
| Help identify trading opportunities by detecting trends and trend reversals | Doesn’t provide an accurate reason for trading opportunities |
These were the pros and cons of using RSI for trading purposes. So, make sure to go through these aspects before utilizing them in your financial strategies.
RSI can be a great indicator for beginners who are looking to step into the trading market. However, we must remind you that this indicator can often be a lagging one, so make sure to use it in co-occurrence with other tools like fundamental analysis, business cycle analysis, and others.
The ultimate choice is yours! So, if your long-term trading strategies and your investment goals align with the RSI strategies, make sure to leverage them to thrive in the unpredictable market.