“Technical analysis is the science of using past price movements to predict future price movements.” – Alexander Elder
No doubt, trading is an exceptional way to earn some extra money. But the sad reality is that it is not a child’s play. Most people find it complex and confusing to start. Even experienced traders sometimes struggle to make consistent profits.
But once you understand and learn its primary aspects and start trading with the right mindset, guidance, and tools, you will be surprised by the profits and progress you make in a short period of time.
Talking of tools, technical analysis is a fundamental tool that can help you understand the whole trading game better and maximize your profit. It enables you to make informed predictions and decisions based on past price behavior and volume.
Let’s take a deeper dive into our topic and learn how technical analysis can help you gain extra profits using intricate details based on historical price movements.
One thing about technical analysis is that it’s a tried-and-tested method. Remember that, the sooner you grasp this technique, the better your prospects in trading. That said, we are here to help you get started quickly with our in-depth guide on technical analysis.
Before we get into that, it’s important to understand that there are two major ways of market analysis: technical and fundamental.
In fundamental analysis, we try to gauge the value of a security based on economic factors like interest rates, geopolitical stability, inflation, and GDP. It also considers financial indicators; for stocks, you examine a company’s financial statements to establish its strength and growth potential, which informs its intrinsic value.

On the other hand, technical analysis takes a different path. It focuses on price trends and patterns based on historical price data to inform investment decisions. At its core, technical analysis looks at the demand and supply for a particular commodity or currency pair. The effects on price and volume are valuable indicators of its future price direction.
Technical analysis uses various tools usually provided by trading platforms to analyze vast amounts of data and generate trading signals. They include:
Charts are the basic unit in technical analysis. They help traders identify price behavior based on past price data and volume. So, to master technical analysis, one must first understand the various types of charts (bar, line, and candlesticks) and then patterns and what they mean.
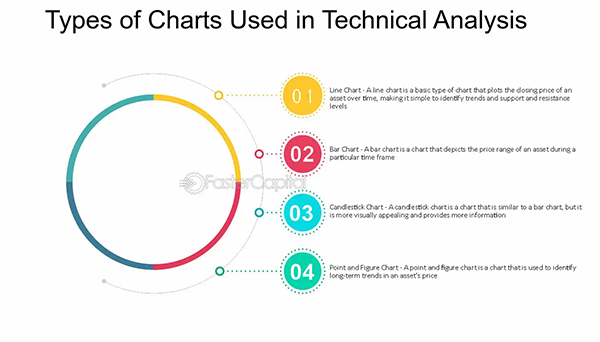
Candlestick charts are by far the most used by traders. They help visualize opening and closing prices in a specific time frame. They show price movements caused by market sentiments and emotions, such as buyers’ and sellers’.
Price changes over time (candlesticks) are displayed on charts in certain shapes and formations (patterns). By spotting certain patterns, such as bullish engulfing patterns and doji, traders can understand market sentiments, which helps them predict future price movements.
Chart patterns can be reversals or continuations. The formation of reversal patterns like a double top or head and shoulder means that the price will likely reverse regardless of its direction. Continuation patterns like triangles and pennants show that the price will maintain its direction.
Alongside charts and patterns, traders should use indicators to identify price direction and momentum and fine-tune their entry and expiry positions. Indicators are mathematical calculations placed over charts that use price data and market sentiment, allowing investors to predict price direction accurately.
Various indicators are used in technical analysis, each serving a unique purpose. One of the most popular is the Moving Average (MA), which calculates the average price by smoothing historical price data. This helps traders identify trends and market direction over time.
Volume indicators, such as Bollinger Bands, measure the strength or weakness of price movements by considering the number of shares traded. These indicators provide insight into how strong or weak a price move is, offering valuable information for decision-making.
Similarly, momentum indicators like the Relative Strength Index (RSI) help determine the speed of price changes and indicate whether a stock is overbought or oversold.
In addition, traders use volatility and trend indicators to further refine their analysis and trading strategies.
Time frames are an important part of technical analysis, allowing traders to view market trends well. Depending on one’s trading strategy, a certain time frame effectively identifies chart patterns.
The time frames range from short-term 5-minute to long-term monthly or yearly charts. Ideally, the longer the time frame, the more reliable the charting and indicators. A trading secret is combining shorter time frames with longer ones to avoid being misled.

DO YOU KNOW?
Many traders believe in the 80-20 rule, which suggests that 80 % of the market’s movement can be understood by technical analysis and the rest 20 % is influenced by fundamental factors.
Technical analysis gives you access to various powerful tools and can help you earn greater profits; however, combining it with fundamental analysis enhances your accuracy in forecasting price movements.
The best part is, that once you master technical analysis, you can apply it to just about any other security, from stocks to currencies.
But also, do not forget that technical analysis is not foolproof, it usually comes with risks, so you must do your due diligence. Do not over-rely on any particular indicator or pattern.
Even following the most effective analysis strategy can only increase your chances of getting successful trades. So, always use appropriate tools, back-test your strategy first, and adhere to proper risk management practices for a fulfilling trading experience.